
I have long been a believer of monitoring systems, even back when computer systems were less complex than they are today.
My journey began with NetIQ AppManager, a product designed to monitor Microsoft Operating Systems, and more, by providing a framework into which you could create custom monitoring rules. It was the bees knees of monitoring at the time. I could create a rule to monitor anything and even tied it into a paging system with a bank of modems (that shows how long ago this was!).
Microsoft bought the product, whilst NetIQ also kept their product available. I was faced with do I continue with NetIQ, or do I take up the special promotion from Microsoft to tempt people away to them? Fortunately, that’s what I chose.
This led to the 2nd generation of monitoring solutions, Microsoft would create all the rules for you, test them, you just had to download, tweak slightly, and suddenly you had thousands of best practice rules monitoring your environment. Gone were the days of manually creating them. Hallelujah!
Then the age of VMware arrived. They had their own monitoring product, Operations Manager, now vRealize Operations. This was another level again, a 3rd generation of monitoring perhaps.
It didn’t just send out point in time email alerts, it crunched all the numbers, it learned my environment, when it was busy, when it was quiet, and in the latest version, it actually uses plain English to tell me there might be an issue.
I also implemented dedicated networking monitoring solutions (which I will say are 100% beneficial due to the nature of what they monitor).
Along the journey I learned about Riverbed’s SteelCentral product, that offered full end to end visibility & monitoring, from individual mouse clicks linked through to database calls, AppDynamics and many others such as LiquidwareLabs Stratusphere, LoginVSI, VMware’s LogInsight & more, however all these were too expensive when proving a ROI would be difficult.
So, 15 years of utilising monitoring systems. Where on earth does Nimble Storage fit into all this? It’s a storage product right?
Well they advertise this infosight product, which gives various information, in addition to what you can access on the box itself. They added per VM visibility recently, and they demoed heat maps of datastore latency, noisy neighbours etc.
As a lover of monitoring solutions, having information available, this sounded great, as it is built into their product, I just had to click two buttons and it was working (far easier than my previous experience with monitoring solutions).
What happened next I was unprepared for. 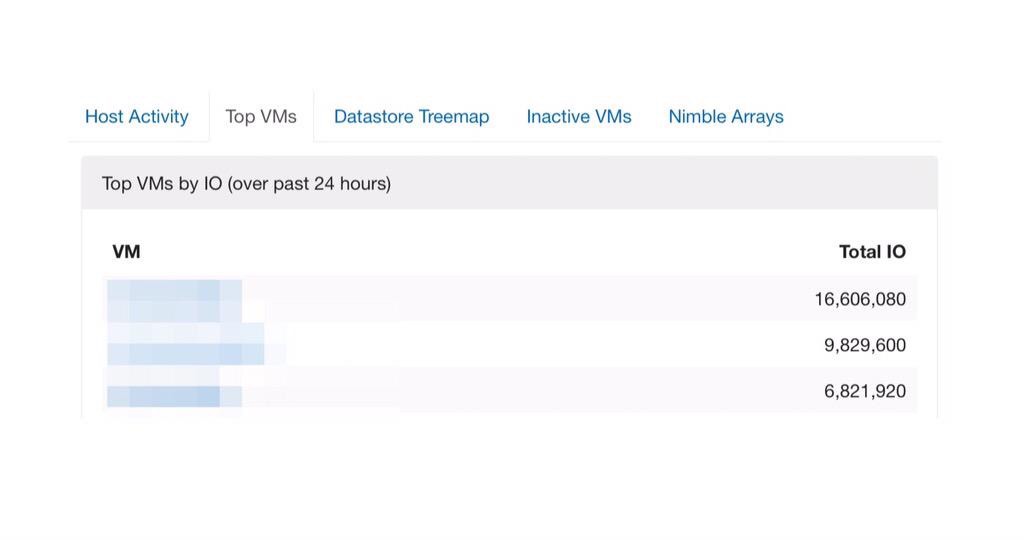
They have this view (above), it shows top IO users per VM. One day I saw our CRM system was 2nd top. What could a CRM system be possibly using all that IO for? I asked the admin of that product, and unknown to him there was a permissions problem causing the sync engine to fail for some users, and kept retrying. First thought, wow! But I have Microsoft Operations Manager, and VMware Operations Manager, dedicated monitoring products, and neither box highlighted this.
That was a one off I thought. Wrong.
A month later, again an unexpected VM was in the top VM list, this time a print server. Someone must be printing something right? I looked on the Nimble array, at the datastore, and it showed high usage once every 5 minutes, but all quiet on the printer spools datastore. A quick file search for recently modified files showed the Microsoft BITS download files were constantly modifying, a restart of that service and the Configuration manager service, and the datastore activity was back to normal.
Two application issues detected by Nimble Storage, that would either not have came to light, or not until later when something else failed to work.
In the space of two months, my Nimble Storage product has detected and allowed me to resolve two non storage related issues that my other monitoring solutions did not. Perhaps there is something to learn here. It is not the collection of data that it is important, it is the surfacing of that information and optimising the path through which the message can be received that is.
I can only congratulate Gim Mahasintunan & his team of data scientists for achieving this. You can watch him present his pre-release (now available) demo of storage performance correlation analysis at storage field day below:
http://www.youtube.com/watch?v=pPly8MWlrzA
Further information:
The Business Value of Per-VM Monitoring in InfoSight http://www.nimblestorage.com/blog/technology/the-business-value-of-per-vm-monitoring-in-infosight/
